So you’ve taken the plunge and decided to switch RPA platforms. You’ve established your baseline metrics and are well on your way to reducing your total cost of ownership, enabling scale, improving returns, and democratizing RPA.
Now it’s time to monitor and track the actual process of RPA platform migration by measuring the metrics that will indicate the success of your migration project. These are the KPIs you should be tracking as you migrate to a new RPA tool, and the ones you should monitor once your migration is complete to ensure success and validate your improved automation ecosystem.
The 3 Metrics to Track During RPA Platform Migration
1. Automation Downtime
Automation downtime refers to the duration that an automated process is unavailable while it is being migrated from one RPA platform to another. The key is to minimize this metric as much as possible to avoid losing any business value while it can’t be executed.
One of the biggest deterrents of switching RPA vendors is the fear that you’ll have to turn the lights off when moving your automated processes between RPA tools. This is significantly heightened if you’re attempting a manual migration where an entire automated process needs to be rebuilt from scratch so it can work in the target RPA tool because all platforms specify process automations differently.
With that being said, some solutions can accelerate RPA platform migrations while minimizing downtime, ensuring that business value isn’t lost and the lights in your automation shop always stay on.
2. Percentage (%) of Processes Requiring Manual Intervention During Migration
By now, anyone’s that’s taken a closer look at migration knows that trying to migrate manually is a massive undertaking. Manual migrations require an entire digital workforce to be completely rebuilt for the target RPA platform.
To give you a rough idea of what a manual migration looks like: a moderately complex automation could take anywhere from 4-6 weeks to rebuild and cost up to $10,000. If you’re migrating 5-10 automated processes, maybe that’s a bill you’d be willing to pay. But what about 100?
That’s why so many customers have turned to Blueprint and our RPA Platform Migration solution to help them make the switch quickly and avoid those lofty investments. Yet even with a third-party provider, it’s still important to measure how effective they are at limiting manual intervention.
An RPA platform migration solution worth its weight will radically limit the work and coding required during migration. For example, Blueprint recently converted 70% of all process flow actions in the 15,000 task bots a client was migrating without any adjustments needed. That’s 70% less work when compared to manual migrations and is equal to millions of dollars in savings.
Read the entire case study here
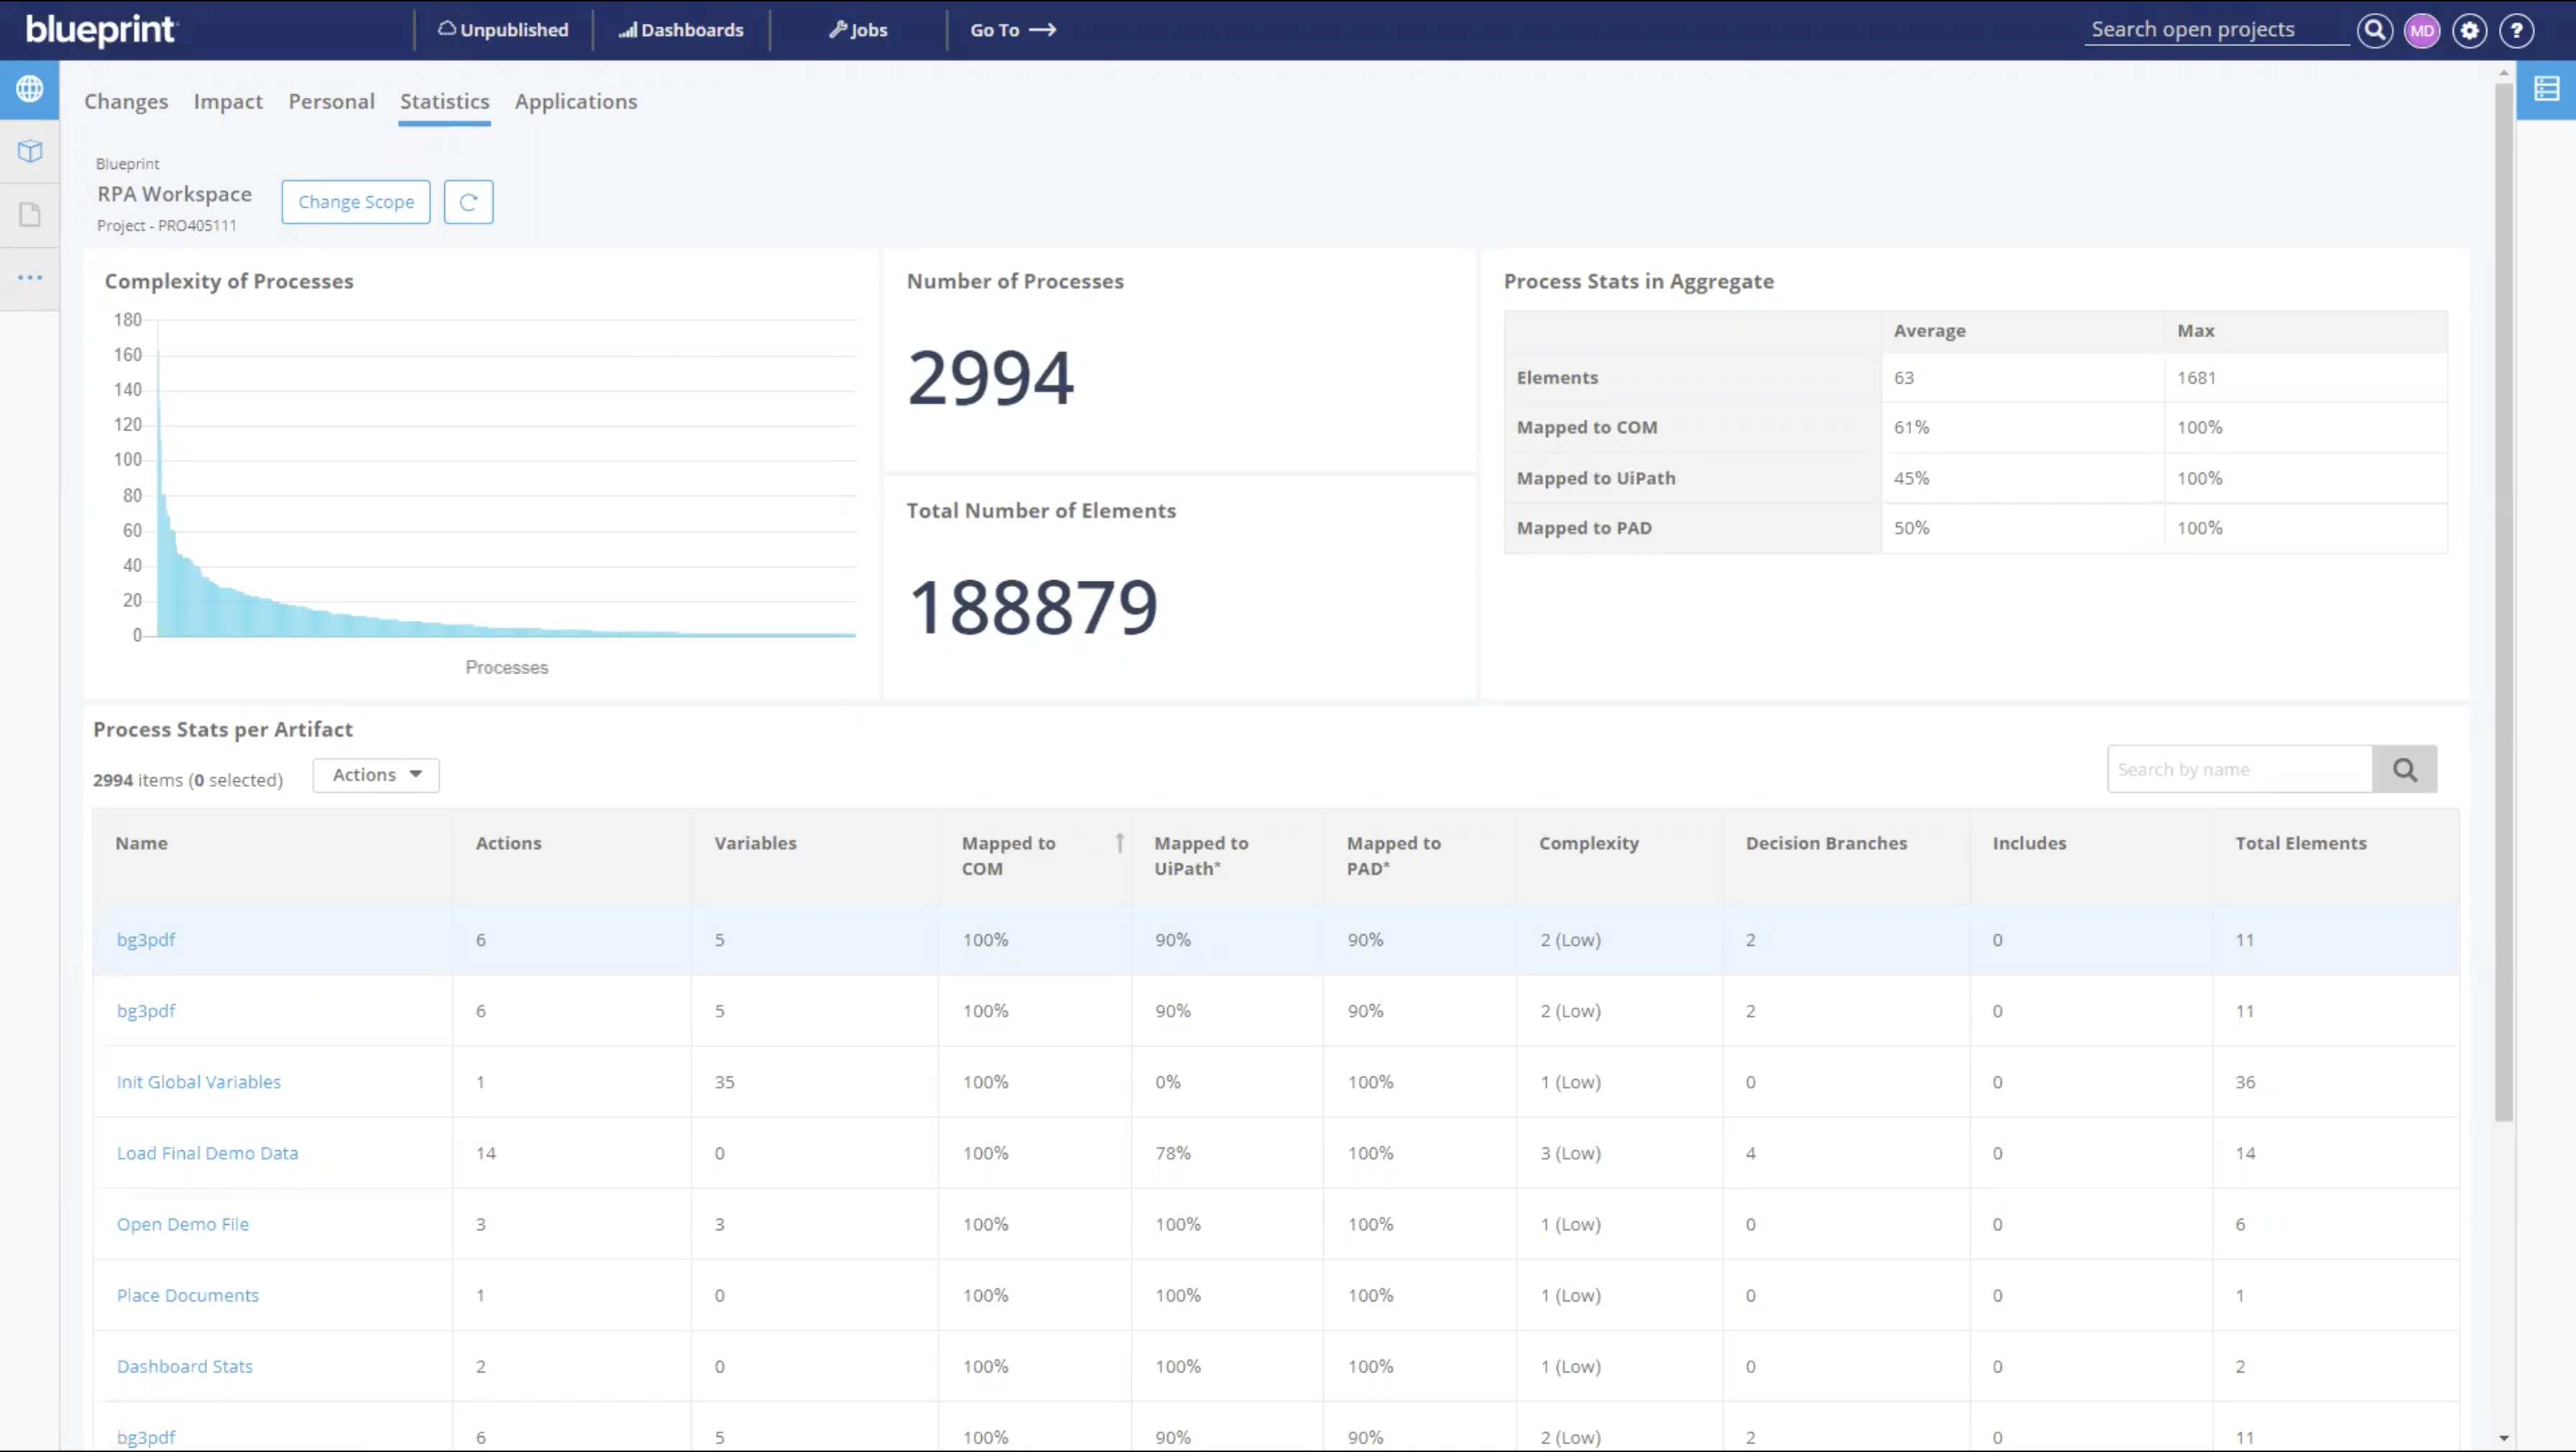
Because Blueprint converts all automated processes into a common model upon ingestion, we also have dashboards that will tell you how much of that process has been automatically converted and is compatible with multiple RPA platforms—in case you’re considering multiple options, enabling you to make more informed decisions based on speed and ease of migration.
3. Total Migration Time per Process
The last key metric to track during the RPA platform migration process is the total amount of time it takes to migrate your digital workforce per automated process. This is a holistic metric that, when averaged out, will enable you to see how your migration efforts or your collaboration with a migration solution like Blueprint’s has fared.
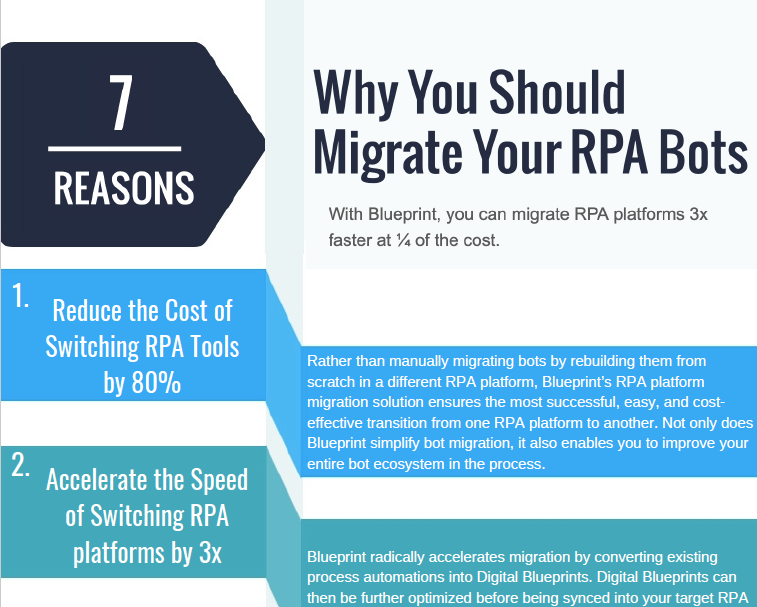
You’ve already seen that a moderately complex migration can take up to 4-6 weeks to migrate manually. With Blueprint, this time can be accelerated by 3x while also reducing costs by 75%.
The Metrics to Track After RPA Platform Migration
Once your migration is complete, it’s time to return to the hygiene metrics that you established before migration. Tracking the same baseline metrics will provide the insight and clarity you need to determine whether the motivators for migration and objectives you set out to achieve have been realized in your new, target RPA tool.
As a summary, those metrics include:
- Design time
- Development time
- Automation uptime
- Total cost of ownership
- Average number of steps per automated process
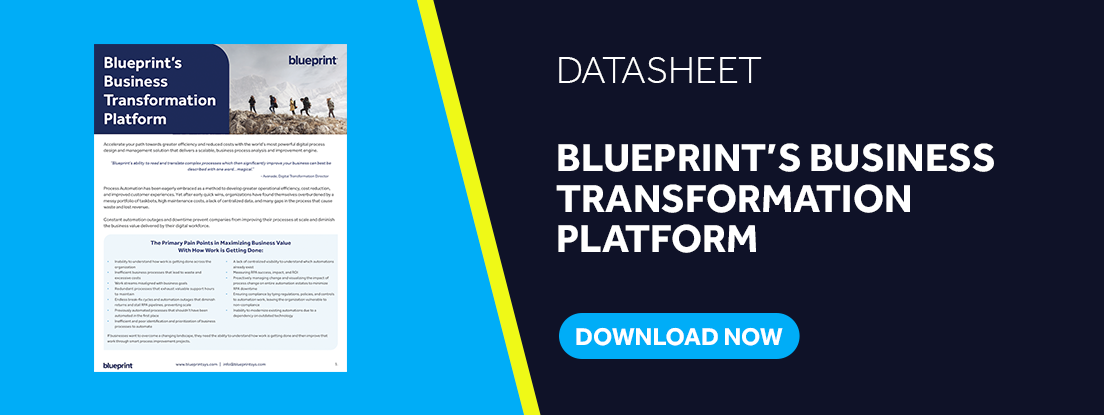
This is another area where Blueprint also provides a helping hand. Blueprint’s Business Transformation Platform acts as the hub where you can consolidate all process capture, automation design, optimization, management, and governance.
Even during the migration process, all stakeholders can converge to optimize your existing automation ecosystem to ensure the hygiene metrics you’re tracking against continue to out-perform your expectations and generate the increased returns and efficiency you’re looking for.
Download the Blueprint Business Transformation Platform datasheet and discover all the benefits Blueprint has to offer, whether your intended use case is migration or implementing hyperautomation.

Share this

3 Ways to Ensure a Successful RPA Platform Migration
The 5 Metrics You Should be Tracking Before RPA Platform Migration