With so many automation programs failing to meet their objectives and deliver on their promised ROI, it’s safe to say that the RPA honeymoon is over. One of the reasons organizations aren’t maximizing their returns from RPA is because automation teams aren’t focusing on the right metrics.
There are five common automation KPIs that are universally monitored. While they each provide definite value, only focusing on those common metrics won’t give your automation program the critical insight needed to drive ROI.
There are more telling KPIs that automation leaders need to be tracking. While less used, these critical RPA metrics provide much more transparency into the health of your automations, the gaps or weak points in your ecosystem, and what needs to be done to maximize RPA ROI.
Here are the five most common RPA metrics being tracked and the five RPA KPIs you should start monitoring to drive automation success.
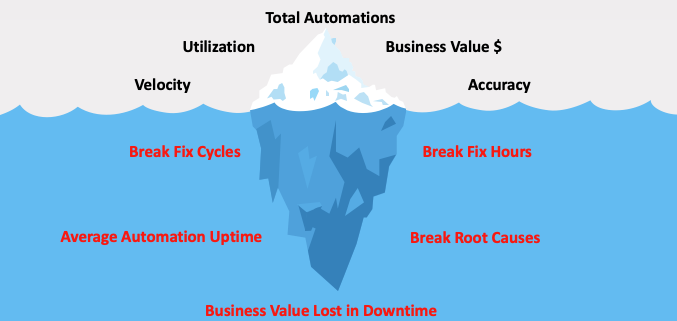
The Five Most Common RPA Metrics
1. Total Automated Processes
Total Automated Processes is the sum of all the automated processes you have in production that make up your bot portfolio or digital workforce.
The reason this is tracked is rather basic; it’s an indication of how RPA programs evolve and grow, how adept teams are at identifying RPA opportunities and prioritizing them through to development, and how mature the organization is in its automation journey.
2. Velocity
Velocity refers to the average time it takes for an automated process to execute. This RPA metric is commonly tracked because it quantifies the time and cost savings of having a bot do the work quicker than an employee.
3. Utilization
Utilization is how often an automated process is executed and when.
Bot availability outside business hours is a crucial value-driving benefit of an automated process. Utilization indicates if you are leveraging 24/7 bot availability, which is one of RPA’s key benefits. Tracking when automated processes are taking place gives you visibility into whether those processes are running outside of normal business hours.
4. Accuracy
Accuracy refers to how often the automated process is executed with errors.
This metric indicates if your automations deliver another key RPA selling point: improved process output quality that yields less errors than manual execution, saving time and money from rework.
5. Expected Business Value
Expected Business Value is an RPA metric that essentially consolidates all the other RPA KPIs. Depending on the process being automated, this KPI is quantified according to different variables. At its most basic, with simple task automation in mind, Expected Business Value delivered is a sum of all the returns calculated from the cost savings accrued from increased velocity, utilization, and improved accuracy multiplied by the cost of an FTE (full-time employee) over a given period.
The Five Additional Automation KPIs You Should Start Monitoring to Drive RPA ROI
1. Break-Fix Cycles
Break-Fix Cycles represents how many times an automated process breaks and requires maintenance.
Many of the pain points RPA programs are experiencing, amplified by their inability to scale and maximize RPA ROI, can be directly traced to this metric. Monitoring Break-Fix Cycles is so telling because it illustrates how resilient or fragile the bots you’ve built are. Bots breaking down directly impact RPA ROI; because the bot is out of production and not running, it’s not reducing costs or contributing to increased operational efficiency.
Our experience in the field indicates that a single bot will break down and need maintenance six times in one year on average.
Learn More: How to Reduce the Rising Costs of RPA Maintenance and Support
2. Break-Fix Person Hours
Break-Fix Hours enables automation teams to understand how long it takes to correct a bot that’s broken and how much manual effort is invested in fixing the bot.
This RPA metric indicates how long the bot’s business value is sitting idle and eating away at the expected RPA returns, in addition to the cost of an FTE to investigate and fix the bot.
We’ve seen that bots with errors are unavailable to execute for an average of 120 hours per Break-Fix Cycle. That includes the time it takes to identify that the bot is broken, investigate the root cause, repair, test, and re-deploy.
3. Break Root Causes
Since so many RPA programs are suffering from constant Break-Fix Cycles, it’s imperative to understand and track why bots are breaking in the first place.
This RPA metric is so critical because it gives you the ability to identify gaps in your automation practices that prevent you from scaling and maximizing your RPA uptime for maximum returns. It doesn’t have to be tied to a fixed period but can give you a better understanding of how your Break-Fix Cycles have evolved over time. This can even be treated as a living catalog.
4. Average Automation Uptime
Average Automation Uptime, also known as bot availability, gives you an indication of how often your bots are available to do what they were designed to do. This differs from utilization because it’s a measurement of a bot’s ability to contribute to the expected business value at all times.
All bots start with a maximum of 100% uptime. When they’re pulled out of production because they’ve thrown errors or broken and require maintenance, uptime starts going down. This metric should be tracked over a set period of time, but the longer the better because the metrics will be more telling. A reasonably accurate average we’ve observed is 92% uptime, which for one bot doesn’t seem bad, but for a sizeable portfolio of one hundred bots, this can mean upwards of $2 million in lost business value as a direct result of downtime, leading to the next metric.
5. Business Value Lost in Downtime
Business Value Lost in Downtime directly results from your bots’ unavailability leaving money on the table and not maximizing returns.
It indicates how damaging your Break-Fix Cycles are to your RPA program and why you might not be getting the returns you were promised and communicated to your executive sponsors. This metric requires subtracting the quantified downtime from the annual expected business value.
Interested in learning more about ROI for RPA? Watch our on-demand webinar and share this RPA ROI analysis within your organization. In this webinar, we show you:
- The most common RPA metrics being monitored and why they don't provide the visibility and insight needed to understand the health of your bot ecosystem
- The 5 little-known but crucial KPIs you need to start watching to maximize the value of your automations
- How to track and measure these critical RPA metrics to see improvements over time


Share this

Automation Uptime: The Key to Maximizing the Value of RPA
During and After RPA Platform Migration: The Metrics You Should be Tracking