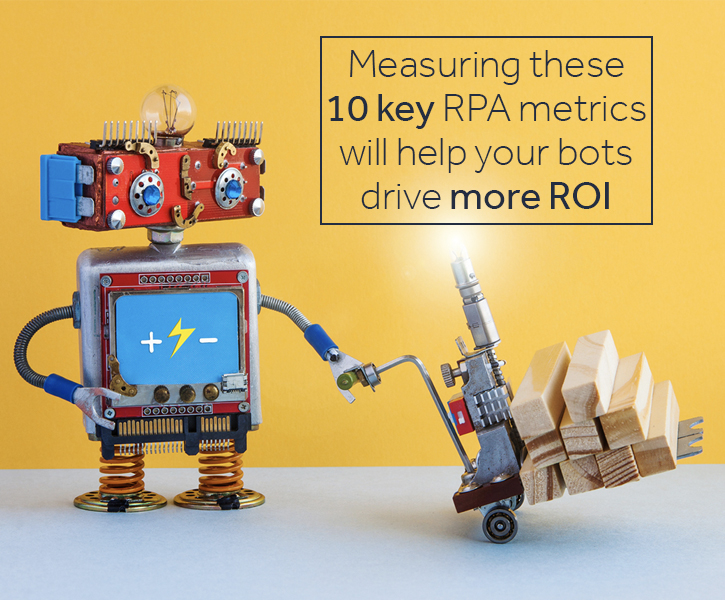
10 Metrics You Should Be Tracking to Drive RPA Success
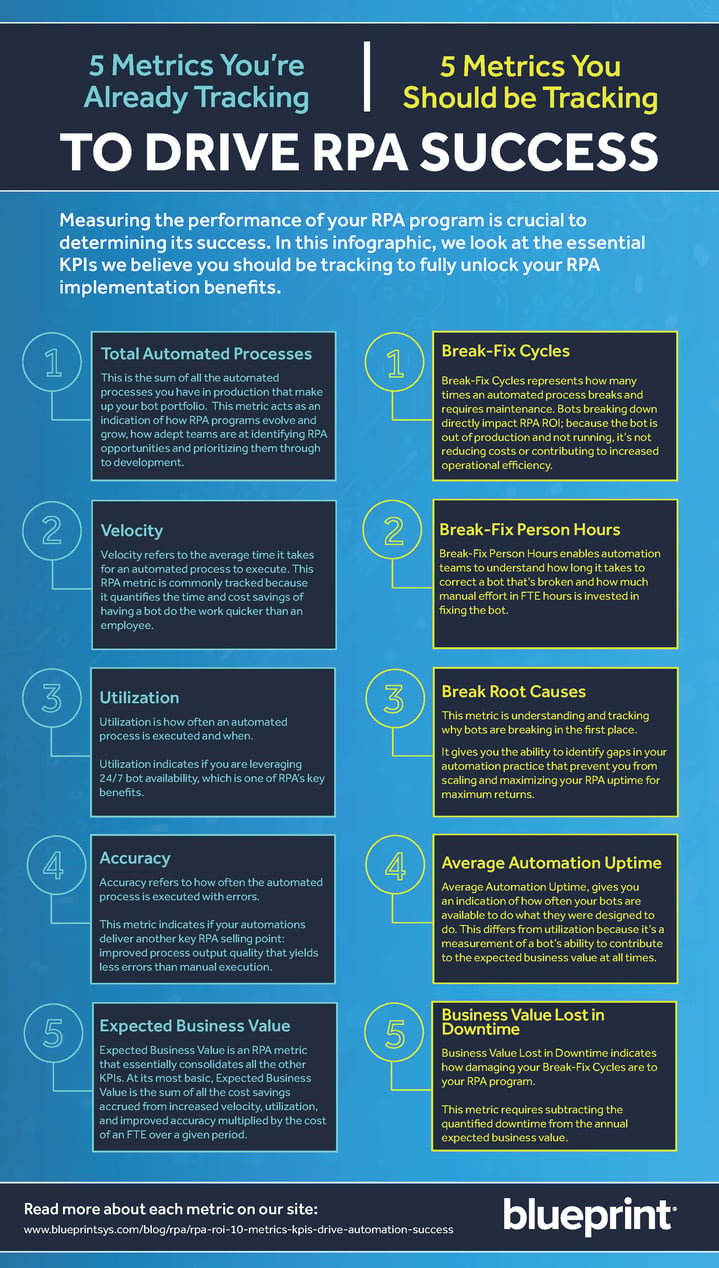
Measuring the performance of your RPA (robotic process automation) efforts is crucial to determining its success. In this infographic, we look at the essential KPIs we believe you should be tracking to fully unlock your RPA implementation benefits.
5 RPA Metrics You're Already Tracking
1. Total Automated Processes
This is the sum of all the automated processes you have in production that make up your bot portfolio. This operational metric acts as an indication of how RPA programs evolve and grow, how adept teams are at identifying RPA opportunities and prioritizing them through to development.
Learn more: Automation Uptime: The Key to Maximizing the Value of RPA
2. Velocity
Velocity refers to the average time it takes for an automated process to execute. This RPA metric is commonly tracked because it quantifies the time and cost savings of having a bot do the work quicker than an employee.
3. Utilization
Utilization is how often an automated process is executed and when. Utilization indicates if you are leveraging 24/7 bot availability, which is one of RPA’s key benefits.
4. Accuracy
Accuracy refers to how often the automated process is executed with errors. This metric indicates if your automations deliver another key RPA selling point: improved process output quality that yields fewer errors than manual execution.
5. Expected Business Value
Expected Business Value is an RPA metric that essentially consolidates all the other KPIs. At its most basic, Expected Business Value is the sum of all the cost savings accrued from increased velocity, utilization, and improved accuracy multiplied by the cost of an FTE over a given period.
5 RPA Metrics You Should Be Tracking
1. Break-Fix Cycles
Break-Fix Cycles represents how many times an automated process breaks and requires maintenance. Bots breaking down directly impact RPA ROI; because the bot is out of production and not running, it’s not reducing costs or contributing to increased operational efficiency.
Learn More: How to Prevent RPA Break-Fix Cycles and Slash Maintenance Costs by 30%
2. Break-Fix Person Hours
Break-Fix Person Hours enables automation teams to understand how long it takes to correct a bot that’s broken. This automation metric indicates how much manual effort in FTE hours is invested in fixing the bot.
3. Break Root Causes
This metric is understanding and tracking why bots are breaking in the first place. It gives you the ability to identify gaps in your automation practice that prevent you from scaling and maximizing your RPA uptime for maximum returns.
4. Average Automation Uptime
Average Automation Uptime, gives you an indication of how often your bots are available to do what they were designed to do. This differs from utilization because it’s a measurement of a bot’s ability to contribute to the expected business value at all times.
5. Business Value Lost in Downtime
Business Value Lost in Downtime indicates how damaging your Break-Fix Cycles are to your RPA program. This metric requires subtracting the quantified downtime from the annual expected business value.
Want to learn more? Watch the on-demand webinar: The RPA Metrics You Should be Tracking to Drive ROI and discover how you can measure and optimize each of these RPA metrics to get the most out of your RPA efforts:

Share this

Automation Uptime: The Key to Maximizing the Value of RPA
RPA ROI: 10 Metrics and KPIs to Drive Automation Success